

Understanding Yang House Feng Shui
Yang House Feng Shui refers to the Feng Shui of living residences. In traditional Chinese metaphysics, a home is not only a physical shelter, but also a field of Qi that influences the people who live within it. The quality of residential Qi may affect family harmony, health, emotional stability, wealth flow, and the long-term fortune of the household.
A well-balanced Yang House supports the residents by gathering vibrant Qi, calming internal conflicts, and creating a more stable living environment. When the home is aligned with suitable directions, spatial order, and energetic balance, the people inside are more likely to experience peace, clarity, and steady development.
Unlike Yin House Feng Shui, which focuses on ancestral graves and future generations, Yang House Feng Shui centers on the daily life and prosperity of the current family. It is closely connected with the home’s entrance, living room, bedrooms, kitchen, stove, water flow, windows, layout, and surrounding environment.
Why Residential Feng Shui Matters
A dwelling is closely connected to the people who live in it. The home receives, stores, and circulates Qi every day. If the Qi flow is smooth, bright, and balanced, it can help nourish the body, stabilize emotions, and support family relationships. If the Qi is blocked, chaotic, weak, or conflicting, residents may feel tired, restless, emotionally tense, or repeatedly troubled by household problems.
Yang House Feng Shui helps identify whether the residence is supporting or weakening the family’s overall fortune. This includes observing the home’s orientation, layout, internal pathways, key functional areas, and how people interact with the space.
The purpose is not to create fear, but to understand the hidden relationship between space and life. With the right adjustments, a residence can become a more supportive environment for health, wealth, harmony, and long-term stability.
Family Harmony and Interpersonal Relationships
One of the most important purposes of Yang House Feng Shui is to harmonize relationships within the family. When the internal Qi of a home is unstable, family members may easily argue, misunderstand one another, or feel emotionally distant.
A professional Feng Shui consultation may analyze whether certain areas of the home are intensifying conflict, weakening communication, or creating pressure between family members. By adjusting layout, direction, lighting, placement, and household energy flow, the home can become calmer and more balanced.
This is especially helpful for families experiencing frequent quarrels, parent-child tension, marital friction, emotional coldness, or long-term household disharmony.
Wealth Stability and Household Fortune
In Yang House Feng Shui, wealth is not only about gaining money, but also about preserving what has already been earned. A residence should help stabilize income and expenditure, reduce unnecessary financial loss, and support steady household development.
The kitchen and stove are especially important in traditional residential Feng Shui. The stove is often regarded as a symbolic treasury of the household. Its position, direction, surrounding environment, and relationship with water or fire elements may influence the family’s ability to gather and retain wealth.
A Yang House Feng Shui consultation may help assess whether the current home layout supports financial stability, whether wealth Qi is easily dispersed, and whether certain areas require adjustment to strengthen household fortune.
Health, Vitality and Wellbeing
A home with balanced Qi can support the physical and mental wellbeing of the whole family. In Feng Shui, health is closely related to air flow, light, room arrangement, sleeping direction, environmental pressure, and the balance between stillness and movement.
If a residence feels heavy, damp, dark, noisy, cluttered, or oppressive, residents may experience fatigue, poor sleep, anxiety, or reduced vitality. Yang House Feng Shui helps observe how the living environment may affect daily energy and emotional state.
Through proper adjustment, the residence can become brighter, calmer, and more nourishing, creating a better foundation for long-term wellbeing.
Descendants, Family Continuity and Household Growth
Yang House Feng Shui also pays attention to family vitality and descendants’ fortune. A stable home should not only support the current residents, but also provide a favorable environment for children, growth, education, and family continuity.
For families concerned about children’s development, parent-child relationships, pregnancy planning, or long-term household prosperity, residential Feng Shui may offer additional guidance. The goal is to help the family create a living space that supports growth, stability, and generational harmony.
What a Yang House Feng Shui Consultation May Include
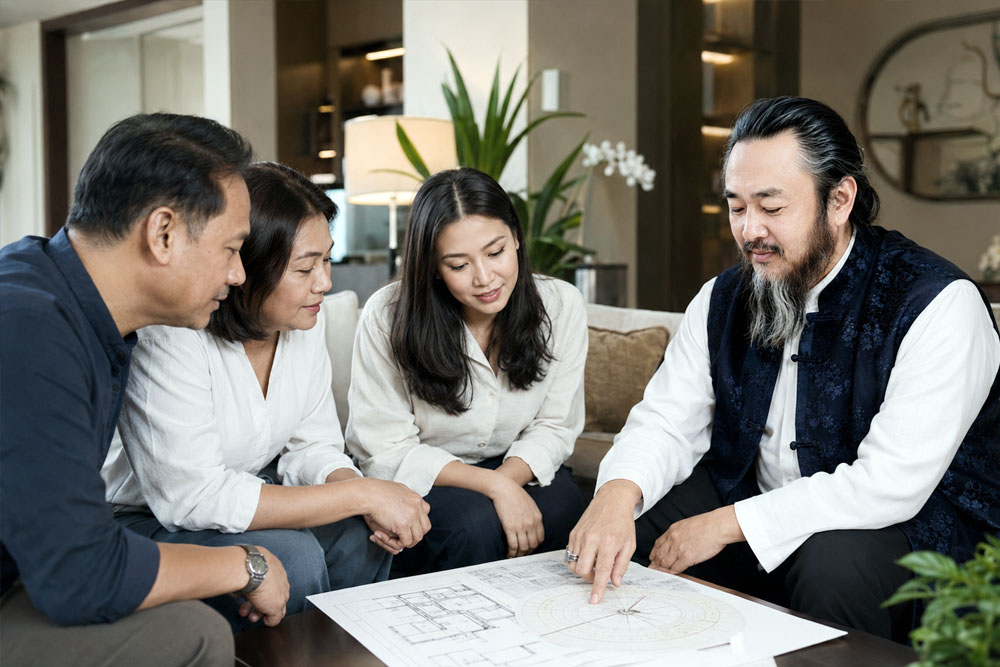
A professional Yang House Feng Shui consultation may include analysis of the home’s external environment, main entrance, internal layout, bedroom arrangement, kitchen and stove position, living room Qi flow, windows, water-related areas, lighting, furniture placement, and key family activity zones.
The consultation may also consider the family’s current concerns, such as relationship tension, wealth instability, health issues, sleep quality, children’s development, or repeated obstacles after moving into the residence.
Based on the analysis, practical recommendations may be provided to improve Qi flow, reduce conflict, strengthen household fortune, and create a more harmonious living environment.
A Traditional Method for Modern Family Life
Although Yang House Feng Shui comes from ancient Chinese wisdom, it remains highly relevant to modern residential life. Today, many people live in apartments, villas, urban homes, or mixed-use spaces where layout, lighting, direction, and energy flow can deeply influence comfort and emotional stability.
A good home should not only look beautiful, but also feel peaceful, supportive, and alive. Yang House Feng Shui offers a structured way to understand the deeper relationship between people and their living environment.
Whether you are moving into a new home, renovating your residence, improving family harmony, stabilizing wealth, supporting health, or creating a better environment for children, Yang House Feng Shui can provide meaningful guidance for household prosperity.
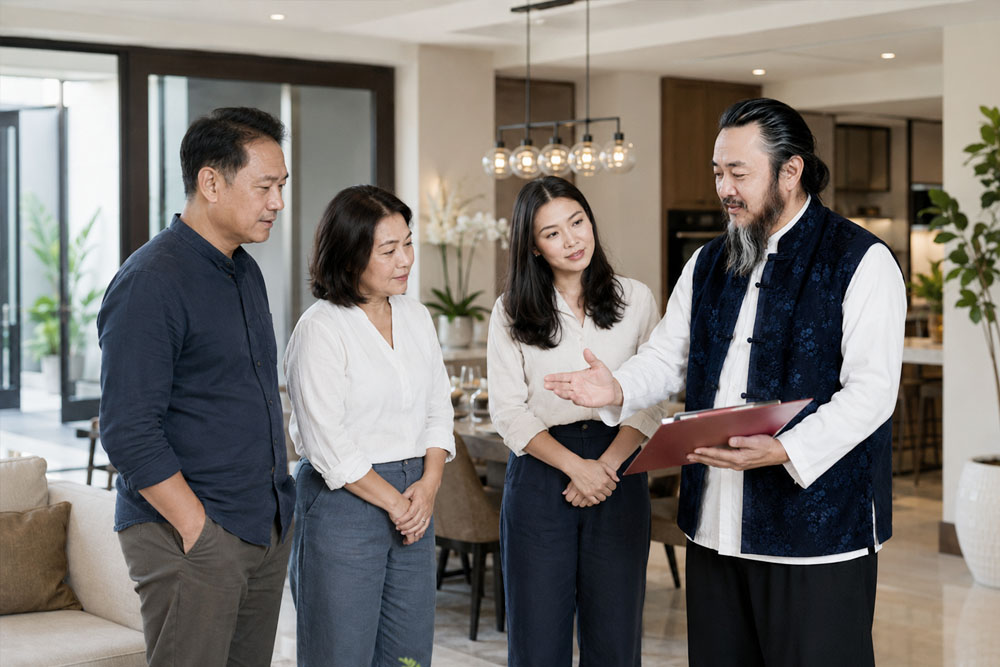
Begin Your Yang House Feng Shui Consultation
If your family is experiencing internal conflict, unstable finances, poor sleep, low household vitality, health concerns, or repeated obstacles after living in a certain residence, a Yang House Feng Shui consultation may help you understand the hidden influences within your home.
Consult with Ruoguzi, the 79th Generation Lineage Holder of Maoshan Shangqing School, to receive traditional Feng Shui guidance for creating a more balanced, harmonious, and prosperous living environment.


